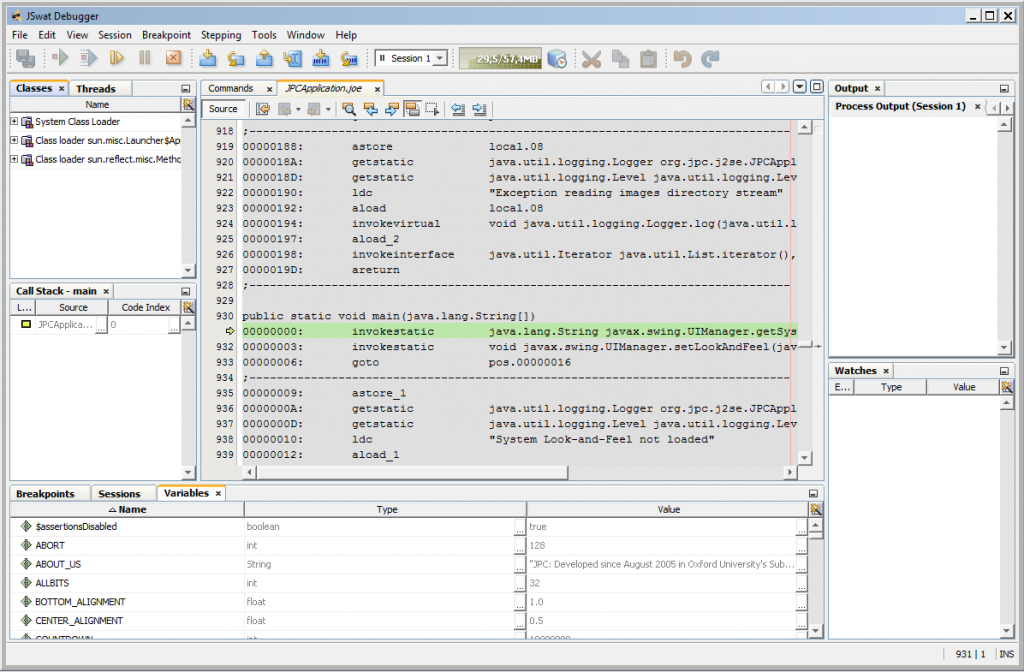
Java bytecode debugging was bugging me for quite some time, however I’ve never done anything to really solve this problem once and for all. Around February I was desperately trying to solve some java bytecode riddle (yup, it was crackme ;p, but shhh…) and the only straightforward solution that would help with analysis was java bytecode debugger. If you query google for java bytecode debugger or java bytecode debugging, it will show two promising entries:
-
Java ByteCode Debugger (JBCD) – http://sourceforge.net/projects/jbcd/ – very old (a.d. 2003), very limited, command line tool, actually I had problems to run it, so I can’t say anything about usability. Project is probably dead anyway ☠
-
Dr. Garbage Bytecode Visualizer – http://www.drgarbage.com/bytecode-visualizer.html – not that old (still in development), very promising plugin for eclipse. It works, but it has some problems and limitations (for example breakpoint can’t be set inside method, only method entry is supported).
I was struggling with this topic until a wild idea came to my head.
The idea
Java .class files supports various debugging attributes which are usually stripped during release compilation. One of those attributes is called LineNumberTable:
LineNumberTable_attribute { u2 attribute_name_index; u4 attribute_length; u2 line_number_table_length; { u2 start_pc; u2 line_number; } line_number_table[line_number_table_length]; } |
LineNumberTable should be defined for each method in the .class file, it enables debugger to match bytecode position (start_pc) with the line number inside the source file. My initial idea was pretty simple, what if generated LineNumberTable match line numbers inside the disassembled source file. Having dirtyJOE as a quite good java .class editor (modesty!) I could easily add such functionality and test how it works. Quick prove of concept shown that this method is really working. I was testing it with JDB and JSwat debuggers:
JDB:
c:\Java\jdk\bin>jdb -classpath e:\_JPCApplication\ org.jpc.j2se.JPCApplication
Initializing jdb ...
> stop in org.jpc.j2se.JPCApplication.main
Deferring breakpoint org.jpc.j2se.JPCApplication.main.
It will be set after the class is loaded.
> run
run org.jpc.j2se.JPCApplication
Set uncaught java.lang.Throwable
Set deferred uncaught java.lang.Throwable
VM Started: Set deferred breakpoint org.jpc.j2se.JPCApplication.main

Breakpoint hit: "thread=main", org.jpc.j2se.JPCApplication.main(), line=931 bci=0
931    00000000:        invokestatic        java.lang.String javax.swing.UIManager.getSystemLookAndFeelClassName()

main[1] step
Step completed: "thread=main", org.jpc.j2se.JPCApplication.main(), line=932 bci=3
932    00000003:        invokestatic        void javax.swing.UIManager.setLookAndFeel(java.lang.String)

main[1] step
Step completed: "thread=main", org.jpc.j2se.JPCApplication.main(), line=933 bci=6
933    00000006:        goto                pos.00000016

main[1] step
Step completed: "thread=main", org.jpc.j2se.JPCApplication.main(), line=941 bci=22
941    00000016:        aload_0
After playing a bit with JSwat, I’ve realized that I’m still missing some information. This little missing thing is called LocalVariableTable and it is another debug attribute that should be defined for every method in the .class file:
LocalVariableTable_attribute { u2 attribute_name_index; u4 attribute_length; u2 local_variable_table_length; { u2 start_pc; u2 length; u2 name_index; u2 descriptor_index; u2 index; } local_variable_table[local_variable_table_length]; } |
Restoring this one is tricky, as it would require building function graph to correctly assign local variable scope (start_pc, length fields). I’ve decided to simplify it a bit. I’m using information about branch instructions and exception handlers to partition function into small chunks (I’ll not call them basic blocks, but they’re similar to basic blocks). Each chunk is scanned for opcodes that are operating on local variables ( a/f/d/i/l-store/load_<n>, iinc) so I can determine the type of a specific variable. All those information are merged and put together into LocalVariableTable attribute. Described mechanism isn’t perfect, but it should be sufficient in most cases (and currently it’s probably the best (only?) solution to this problem).
This is the end of my idea, but it isn’t the end of that topic. Java VM is a stack based virtual machine, which means that most of all opcodes operates on the operand stack. Having information about values pushed onto the stack sometimes can be crucial to understand what is really going on. Unfortunately neither JDB nor JSwat supports previewing of jvm operand stack. This is an unresolved problem for now.
dirtyJOE
Above ideas are implemented in dirtyJOE v1.6, they’re called Restore Debug Info and are accessible from GUI as well as from a command line. There is also LocalVariableTable editor, so if anyone feel that automatically generated LocalVariableTable isn’t enough, one can freely edit all aspects of the local variable (e.g. name, type). Command line support was introduced to help with restoring debug info in multiple files. Below command will restore debug information for all files in the current directory and all subdirectories (.joe files will be placed in the same subdirectories as input .class files):
for /R %c in (*.class) do start /WAIT dirtyJOE.exe /rdi "%c"
start /WAIT is crucial if you don’t want to mess the console, as dirtyJOE isn’t a console application so without this command it will run asynchronously. Most debuggers should automatically pick up generated disassembled source files (.joe), just set the proper sourcpath in the debugger settings. JSwat is even able to load source files from the .jar file, so disassembled .joe files can be repackaged into the original .jar file.
That’s all for now.


[…] Java bytecode debugging was bugging me for quite some time, however I’ve never done anything to really solve this problem once and for all. Around February I was desperately trying to solve some java bytecode riddle (yup, it was crackme ;p, but shhh…) […]
Wow, interesting. Can you please post more.
Windows only? Doh.
Yup, you may try to use dirtyJOE through WINE, it should work. As for the rest of the topic, it’s pretty much platform independent.
How get all command line commands ?
not sure if I understand, all dirtyJOE command line options are described in the help file.